Categories
Corporate Finance

The Time Value of Money

time value of moneyOne of the most important concepts in corporate finance is the time value of money. This concept is crucial in areas like capital budgeting, lease-or-buy decisions, accounts receivable analysis and many others. The time value of money is the relationship between $1 now and $1 at some time in the future.

We can illustrate the time value of money with an example. Imagine someone offered you $1000 as a gift. They said you could either have the $1000 right now, or you could have the money in 10 years from now. Which would you choose? Most rational people would choose to get the money now. This is because if you get $1000 now, you can make use of the money right away (to buy things, invest it, etc.) rather than wait. Additionally, who knows what the state of the world will be in 10 years, the dollar may have depreciated or even worse, the world may have ended. Clearly, receiving $1000 now is more valuable to most people than receiving $1000 in the future. In summary, benefits are foregone by waiting for money.

The time value of money is why “rational” people who lend money, require something more than just the principal to be repaid. The longer the lender has to wait for repayment and the riskier the loan, the more they require in return.

This means that dollar amounts received at different points in time must be converted to their values at a common date so that the amounts can be compared. To compare amounts at different time periods we introduce the two fundamental time value of money concepts: future value and present value.

Future Value

Because of the time value of money, it’s better to have money now rather than some time in the future. Think about the difference between having $100.00 now and $100.00 in one year from now. If you have $100 now, you can invest it in a savings account that earns, let’s say, 5% interest per year. This means that at after one year, you will have $105.00. The $105.00 is what is called the future value of $100.00 in one year when the rate of return is 5%.

Multiple Periods

For multiple years (or time periods), interest is compounded which means that interest is calculated on interest. Therefore, after two years at an interest rate of 5%, the future value of $100 is:
$100.00 x 1.05 x 1.05 = $110.25

To summarize, future value is the amount a present some of money will be, given a specified time period and interest rate.

For those who are mathematically inclined, here is the general formula to calculate future value:

FutureValue = PresentValue x (1 + InterestRate)NumberOfPeriods

Present Value

In order for investors to compare future cash inflows, it’s convenient to determine the value of money received in the future to its value today.

For example, suppose you need to accumulate $100,000 over 10 years for your child’s education. You happen to have cash available to make an investment that returns 7% per year. How much would you need to invest now in order to have $100,000 in 10 years? This amount represents the present value of $100,000 in 10 years at a 7% interest rate. To find present values, we can rearrange the future value formula above to show that:

PresentValue = FutureValue / (1 + InterestRate)NumberOfPeriods

For our exampe:

Present Value = $100,000 / (1 + 1.07)10 = $50,834.93

This means that at a rate of return of 7%, you would have to invest $50,834.93 for 10 years to accumulate $100,000.

Net Present Value (NPV)

Net Present Value or NPV for short, is another key concept for making financial decisions. Should you go ahead with that project? Should you buy that machine? NPV builds builds upon the idea of present value by including the current cost of an activity or investment, rather than just calculating the returns of the activity or investment. Simply put, the present value of all costs are calculated and compared with the present value of all future returns. The investment deciscion is then based on comparing these numbers.

NPV = Present value of investment returns – Present value of investment costs

As a rule, an investment is worth making if it has a positive NPV. The investment should be rejected if it has a negative NPV.

Annuities

In many cases, cash from investments is received at over time at regular intervals. Retirement pensions, leases, mortgages and pension plans are all annuities.

Calculating present and future values of annuities is also possible but a bit more complicated.

Financial Calculators Make Life Easier

Many calculators for calculating present values, future values and annuities are available. An easy to use financial calculator is available on our Free Financial Calculator page.

Categories
Accounting

Breakeven Calculation

Breakeven CalculationLet’s say you’re trying to decide whether or not to produce a certain product. Say a new type of cuddly teddy bear. You’ll inevitably ask yourself “how many teddy bears do I need to sell to break even?” Breakeven analysis helps you answer that question.

The first step is to figure out the costs involved. This is the toughest part because there are two types of costs – fixed costs and variable costs. You need to figure out both.

Fixed costs: These are costs that you have to pay regardless of how many units you produce. In our teddy bear example, fixed costs would include:

  • the cost you pay an artist to sketch out the bear so a prototype can be made
  • the cost of a prototype
  • what it costs you in time (and/or gas money) to find an appropriate manufacturer
  • and so on…

The point is that you’d have to pay these costs even if you only produced one teddy bear.

Variable costs: These are the costs for each additional unit produced. Continuing with our teddy bear example, each bear is made up of materials (such as fabric, foam stuffing etc.) that you have to pay for. The more bears you produce, the more you have to pay in materials. These materials are variable costs because they vary with the number of units produced.

Total Cost: Once you’ve figured out your fixed costs and your variable costs, you can get your total cost. The total cost will also depend on how many units you decide to produce. It’s pretty obvious that the more bears you make, the more it will cost you. Let’s say we calculated our fixed costs to total $5000. As for variable costs, we determined that it will cost $5 to produce each additional teddy bear.

For example, let’s say we decide to produce 2000 bears:

Total cost = fixed costs + (variable costs × quantity produced)
Total cost = $5000 + ($5 × 2000)
Total cost = $5000 + $10,000

Therefore, the cost to produce 100 units is:

Total cost = $15,000

Price: The final ingredient to find your breakeven point is to the price you’re going to sell the teddy bears for. Let’s say you determine the optimal price is $35.00. (For tips on setting a price, see our pricing article: Setting a price) In our example, this means that each bear will contribute $30.00 ($35.00 – $5.00) to covering your fixed costs and earning profit.

As a side note, accounting nerds call the difference between the price and the variable cost per unit the contribution margin per unit. As shown above, the contribution margin for our example is $30.

Calculating Your Breakeven Point

Finally, we show how to get the breakeven point:

Profit = Revenues – Costs
Profit = (Price x Quantity) – (Fixed Costs + (Variable Costs × Quantity))

The breakeven point means that profit is $0 by definition. So we can use $0 for profit in our formula above.

0 = (Price x Quantity) – (Fixed Costs + (Variable Costs × Quantity))

Rearranging the above formula we can show that the quantity at which profit is $0 is:

Quantity = Fixed Costs ÷ (Price – Variable Costs)

For this teddy bear example the number of units we need to sell to breakeven is:

Breakeven point in units = $5000 ÷ ($35 – $5)
Breakeven point in units = $5000 ÷ $30
Breakeven point in units = 167

Therefore you would need to sell 167 teddy bears to cover all of your costs.

Make Life Easy With a Breakeven Calculator

It’s beneficial to use understand the principles outlined above, but why not make life easier? Instead of bothering with the formulas above, use our free breakeven and profitability calculator to save time.

Categories
Accounting

Financial Statement Analysis – Ratios

Financial Ratio AnalysisComputing and interpreting financial ratios is the cornerstone of financial statement analysis. The main financial statements are the balance sheet, income statement and statement of cash flows. Ratios are fractions that show the relationship between the numerator and denominator. These ratios are computed as a convenient way to see how the firm is performing financially.

For the ratios to have meaning, they need to be compared to at least one of the following:

  • The firm’s historical ratios
  • The ratios of other firms of similar size, in the same industry

Financial ratios provide information about five areas of financial performance:

  1. Profitability: The company’s level of profitability (return on shareholders’ equity)
  2. Short-term liquidity: The company’s ability to meet short-term obligations
  3. Financial leverage: The extent to which the company relies on debt financing
  4. Activity: How effectively the company’s assets are being managed
  5. Value: The value of the company

We’ll take a look at some ratios in each of these categories.

Profitability Ratios

The profitability of a firm is difficult to gauge. Profitability from an accounting perspective is the difference between revenues and costs. However, firms typically take on projects that sacrifice current profitability for future profitability. New projects often require considerable funds to start, and may only cover their costs years down the road. This means that current profitability may be a poor measure of true future profitability.

Common profitability ratios are net profit marginreturn on assets, and return on equity.

Net Profit Margin

Profit margins are calculated by dividing profit by total operating revenue.

Net profit margin = Net income ÷Total operating revenue

Profit margin ratios are not a direct measure of profitability. This is because they aren’t based on total operating revenue. Additionally, profit margin ratios are not based on the investment made in assets. Profit margins reflect the ability of the firm to produce projects or services at a low cost, or to sell them at a high price.

Return on Assets

Return on assets (ROA) is the ratio of income to average total assets. The ratio is often calculated both after and before tax. It’s a common measure of managerial performance.

Net return on assets = Net income ÷ Average total assets
Gross return on assets = Earnings before interest and taxes ÷ Average total assets

Retrun on Equity

Return on equity (ROE) is calculated by dividing net income after interest and taxes by average common shareholders’ equity. It is the return to the company owners.

ROE = Net income ÷ Average shareholders’ equity

Short-Term Liquidity Ratios

Short-term liquidity (or solvency) ratios measure a company’s ability to pay its bills. Liquidity is often associated with net working capital (the difference between short-term assets and short-term liabilities).

The most widely used liquidity ratios are the current ratio and the quick ratio.

Current Ratio

The current ratio is found by dividing current assets by current liabilities. These values are found on the balance sheet.

Current ratio = Total current assets ÷ Total current liabilities

A higher current ratio usually means greater liquidity. It should be compared to the ratios of firms with similar operations, as well as to calculations over previous years for historical perspective.

It’s possible for this ratio to be too high. It may indicate excessive inventory or difficulty collecting accounts receivable.

Quick Ratio

The quick ratio is calculated by subtracting inventories from current assets (called quick assets) and subtracting the difference by current liabilities.

Quick ratio = Quick assets ÷ Total current liabilities

Quick assets are assets that can by quickly converted to cash. Inventory is usually the least liquid current asset. It may be important to determine the ability of a firm to meet short-term obligations without relying on sales of inventory.

Financial Leverage

Financial leverage ratios show how dependent the firm is on debt financing as opposed to equity financing. The more debt a firm has, the harder it is to fulfill its contractual obligations. High debt ratios increase the probability of insolvency and financial distress.

Two commonly used leverage ratios are the debt ratio, and the interest coverage ratio.

Debt Ratio

The debt ratio is found by dividing total debt by total assets. It provides a measure of the ability of the firm to pay off its creditors.

Debt ratio = Total debt ÷Total assets

It’s important to note that debt ratios don’t take interest rates or risk into account. Additionally, some forms of debt such as lease obligations may not appear on the balance sheet at all.

Interest Coverage

The interest coverage ratio is calculated by dividing earnings before interest and taxes (dividend earnings) by interest. This ratio measures whether a firm is able to generate enough earnings to cover its interest expense. Paying interest is necessary for a firm to avoid default. A large debt burden becomes a problem when the firm’s cash flow isn’t enough to make the debt service payments.

Interest coverage = Earnings before interest and taxes ÷ Interest expense

Activity Ratios

Activity Ratios measure a company’s effectiveness in managing its assets. There commonly used activity ratios discussed below are total asset turnover, receivables turnover, and inventory turnover.

Total asset Turnover

Total asset turnover shows how effectively a firm is using its assets to generate revenue. It is found by dividing total operating revenue by average total assets.

Total asset turnover = Total operating revenues ÷ Average total assets

  • Operating revenue is revenue generated from the operating activities of the company. It excludes interest revenue.
  • Average total assets are the average of the assets at the beginning of the period, and the assets at the end of the period.

If the asset turnover ratio is high, it presumably means that the firm is using its assets efficiently to generate sales. Again, for a meaningful interpretation, the value should be compared with other firms of similar size in the same industry and/or to the company’s historical values.

Receivables Turnover

The receivables turnover ratio is used to gauge how well the firm manages its accounts receivables. It can be used to determine the average time it takes to collect customer payments.

The receivables turnover ratio is calculated by dividing sales by average receivables during the period.

The average time it takes to collect payments from accounts receivables can be found by diving the number of days in the year (365) by the receivables turnover ratio.

Inventory Turnover

The inventory turnover ratio is used to find out how long it takes for inventory to be produced and sold.

The inventory turnover ratio is calculated by dividing the cost of goods sold by the average inventory level.

The number of days it takes to produce and sell goods (days in inventory ratio) is calculated by dividing the number of days in the year (365) by the inventory turnover ratio.

Company Value Ratios

The market value of a firm cannot be found on an accounting statement. We’ll briefly cover some common ratios used to value publicly traded companies.

The market price of a share of a firm’s common stock is the price that buyers and sellers establish when they trade. Different companies have widely different stock prices, financial analysts calculate ratios to extract ratios that are independent of a firms size. Two common value ratios are the price-earnings ratio and the dividend yield.

Price-Earnings (P/E) Ratio

The price-earnings ratio is the defined as the market price for a stock divided by its current annual earnings per share.

P/E ratio = Share price ÷ Earnings per share

The P/E ratio shows how much investors are willing to pay for $1 of earnings per share. The P/E ratio reflects investor belief in the growth potential of the firm. Investors who buy the stock of firms with high P/E ratios expect large earnings growth.

Dividend Yield

The dividend yield is computed by dividing the last dividend payment (annualized) of a firm by the current market price.

Dividend yield = Dividend per share / Market price per share.

Like P/E ratios, dividend yields are related to investor’s expectation of future growth prospects for firms. Firms with higher growth prospects usually have lower dividend yields. This is because firms typically pay out less dividends to shareholders if they can invest the cash into promising projects.

Pitfalls of Financial Ratio Analysis

Financial ratios are a powerful tool to help gauge company performance, but they shouldn’t be relied on blindly. It’s important to be aware of their limitations.

For one, there is no underlying theory with financial ratio analysis to help identify which quantities to examine, or to guide in establishing benchmarks. This is why individual experience and judgement play a big role.

Other problems are common. For example, unusual events, such as a one-time profit from a sale of a building, can affect financial performance. This can give misleading signals when comparing companies.

Categories
Accounting

Measuring Cash Flow – The Cash Flow Statement

cash flowAs discussed in another article, the income statement provides a measure of an organization’s performance in generating net assets. Because net assets are claims on cash, the income statement doesn’t measure the organization’s performance in generating cash directly. Many businesses with strong income statements have gone bankrupt because they were unable to come up with the cash needed to meet their obligations.

Cash is vital to organizations. Creditors must be paid in cash and businesses are usually formed in order to return cash the owners. The statement of cash flows (or cash flow statement) provides decision makers with a financial statement that focuses on cash. A cash flow statement reports cash receipts and cash payments of an organization during a particular time period. Both cash flow and income statements report activities over a span of time.

The basic concept of a cash flow statement is simple:

  • Activities that increased cash (cash inflows) and those that decreased cash (cash outflows) are listed
  • Each cash inflow and outflow are categorized into one of three corresponding categories:

    1. Operating activities: Transactions affecting the sale, purchase, or production of goods and services.
    2. Investing activities: Include acquiring and selling of long-term assets and securities held for long-term investment reasons.
    3. Financing activities: Include acquiring and selling resources from owners and creditors and repaying these amounts.

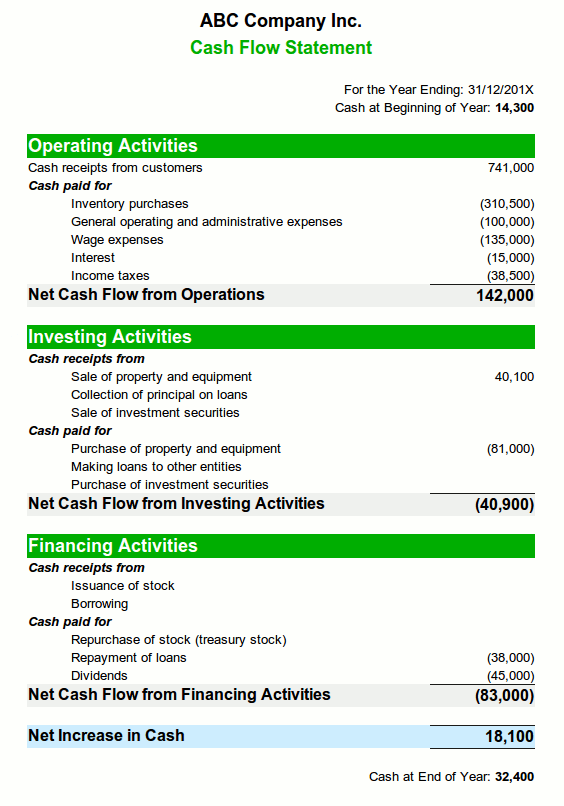
Below is an example of a cash flow statement for a fictitious enterprise called ABC Company Inc. The statement is broken up into three main areas – operating, investing and financing activities. The net increase in cash is shown at the bottom of the income statement.

example cash flow statement


Categories
Accounting

Measuring Performance – The Income Statement

measuring incomeThe economic performance of an organization over a period of time is reported by an income statement. It reports all revenues and expenses over a specific time period. This differs from the balance sheet, which shows the financial status of an organization at a specific point in time.

The main sections of the income statement include:

  • Revenue
  • Expenses
  • Net Income

Revenue is commonly generated through the sale of the company’s products. Other sources of revenue include shipping charges, interest from investments and grants from government agencies. Revenues increase owner’s equity by increasing the organization’s assets.

Expenses are cash or asset outflows to other entities. Organization’s require products, services and resources to function. These must be paid for. Examples of expenses are telephone charges, salaries and the cost of the goods the organization sold.

Net Income is what’s left over after all expenses have been deducted from revenues, often referred to as “the bottom line”, or simply “income”. If revenue exceeded expenses during a given time period, then the organization had a net gain and net income was a positive number. If revenues were less than expenses, then the organization had a net loss and net income was a negative number. All or some of the net gains during the given time period may be paid out to the owners in the form of dividends. Alternatively, the net gain can be retained by the organization (called retained earnings) and reinvested.

Below is an example of an Income Statement for a fictitious enterprise called ABC Company Inc. The statement is broken up into two main areas – revenue and expenses. The net income amount is shown at the bottom of the income statement.

example-income-statement

While most financial statements do not include many expense accounts with a zero balance, we have included them here to provide examples of common expense accounts.

Accounting Software to the Rescue

Pretty much any modern accounting system software package will allow you to generate financial statements like the income statement based on the transactions that were entered. This is a big time saver because it makes producing financial statements by hand unnecessary. While it has become easy to create financial statements using software, it’s still important to be able to read and interpret the statement.

If you’re curious about what a full featured accounting system looks like, take a look at our available accounting software.

Categories
Accounting

Measuring Financial Position – The Balance Sheet

One of the main financial statements used by decision makers in an organization is the balance sheet. The balance sheet shows the financial status of an organization at a specific point in time. It’s a “snapshot” of how the firm is doing. It also referred to as the statement of financial position or the statement of financial condition. This differs from the income statement, which shows the performance of an organization over a period of time.

The balance sheet is broken up into three main areas. Assets, liabilities and owner’s equity. A description of each category follows.

Assets

Companies have things of value such as cash, inventory, buildings and so on. These are called assets because they are expected to be used to generate cash inflows in the future.

Liabilities

Companies also have obligations such as supplier bills and bank loans that will result in future cash outflows. These are called liabilities.

Owners’ Equity

Let’s say you own a company. What this company is worth to you, the owner, is called owner equity (or Stockholders’ Equity for corporations). Owner equity the difference between its assets and its liabilities. In other words, the company is worth what it has of “value” minus what it owes. We can write this “rule” out as an equation:

Owner Equity (Value of company) = Assets (What the company has of value) – Liabilities (What it owes)

The above “balance sheet equation” must always hold true or “balance”. A balance sheet lists items in each of these three categories (assets, liabilities and owner equity). Accountants prepare balance sheets with assets on the left side of the equation, and equity on the right side. We can rearranging the above equation to show that:

Assets = Liabilities + Owner Equity

Balance Sheet Essentials

  • Assets: Resources that are expected to result in future cash inflow or a decrease in future cash outflow. Examples include, cash, inventory and equipment.
  • Liabilities: Economic obligations of the organization to outsiders that are expected to cause a cash outflow or decrease in cash inflow. Examples include payables to suppliers and bank loans.
  • Owner Equity: The remaining claims against the company’s assets after deducting liabilities. It’s essentially the amount left over after subtracting liabilities from assets. It includes the owner’s investment and retained earnings. Retained earnings are the portion of profits reinvested in the business).

Short and Long Term Assets and Liabilities

On a balance sheet, assets are usually broken down into short-term (current) assets and long-term (Fixed) assets.

  • Short-term assets are assets that are expected to be “used up” within the next year or so. Examples include cash and inventory.
  • Long-term assets refer to assets that are held over a longer period of time. Examples include long-term investments, cost of property and equipment (e.g. land, buildings, equipment, tools, furniture, vehicles, etc.)

Similarly, liabilities are separated into current (short-term) and long-term liabilities.

  • Current liabilities include the obligations to be paid within one year. Examples including accounts payable, short-term loans, income taxes payable, wages, and portions of long-term debt payable within the year.
  • Long-term liabilities include long-term debt (e.g. mortgages), leases structured as loans.

Below is an example of a balance sheet for a fictitious enterprise called ABC Company Inc. You’ll notice that the total assets equals total liabilities plus owner equity.

example balance sheet

In this example, owner’s equity includes the owner’s initial investment and retained earnings. As mentioned, retained earnings result from company profits that are re-invested by the owners into the firm.

Accounting Software to the Rescue

Pretty much any modern accounting system software package will allow you to generate financial statements like the balance sheet based on the transactions that were entered. This is a big time saver because it makes producing financial statements by hand unnecessary. While it has become easy to create financial statements using software, it’s still important to be able to read and interpret the statement.

If you’re curious about what a full featured accounting system looks like, take a look at our available accounting software.


Categories
Accounting

Basic Accounting Concepts

This article deals with basic accounting principles that most business people and managers need to be familiar with.

What is accounting?

Accounting is the main way information about economic activities is communicated. Accountants analyze, classify, record, summarize and interpret economic transactions. This information is then provided to decision makers in the form of financial statements. The primary emphasis is on providing clear information to others, so that they can make informed decisions for the organization.

Accounting is also important for the day-to-day operation of businesses. It helps companies pay their bills and taxes, keep track inventory, and reduce theft and fraud.

Accounting to Help Decision-Making and to Measure Performance

Organizations have financial goals. Accountants use available data to measure the results of the activities of an organization. The results are then reported to help decision makers measure financial success. Accounting information is helpful to those responsible for making decisions about the activities of an organization. Business owners, managers, investors as well as politicians are all examples of this type of decision maker.
Accounting helps decision makers in various ways including:

  • Evaluating organizational performance
  • Showing where and when money has been spent
  • Showing what is owed
  • Predicting future effects of today’s decisions
  • Comparing one possible course of action to another
  • Finding current problems, inefficiencies and opportunities

Financial and Managerial Accounting

Accounting can be subdivided into two fields –financial and managerial. “Financial accounting” serves decision makers outside the organization such as government agencies, shareholders and banks. “Managerial accounting” serves internal decision makers such as managers and owners. The financial statements we discuss on this website are common to all areas of accounting.

Generally Accepted Accounting Principles

Accountants are required to adhere to a set of guidelines and detailed practices in accounting. These are known as the Generally Accepted Accounting Principles or GAAP (pronounced “gap”). It allows for a relatively standardized way of reporting financial information. This is helpful because if different accountants were to use different measures and rules, decision makers would find it more difficult to compare and interpret accounting information. Different countries have their own versions of GAAP, but they usually have a lot in common.

With respect to corporations, financial statements that are prepared for external stakeholders, such as governments and shareholders, are required to conform to GAAP. Accounting information intended for internal use only, doesn’t have to adhere to GAAP.

Financial Statements

As mentioned, financial statements prepared by accountants are used to help decision makers make informed decisions. The main financial statements used by decision makers are the balance sheet, income statement and cash flow statement.

  • The balance sheet shows the financial status of a business at a particular point in time. How much cash the company has on hand, how much it owes, and the value of its inventory are all examples of what you’d find on a balance sheet. The balance sheet is sometimes called the statement of financial position.
  • The income statement is a measure of the performance of a business over a period of time. The income statement is also called the profit and loss statement or simply the “P & L statement”.
  • The cash flow statement (or statement of cash flow) reports the cash payments and cash receipts of a business over a period of time. As the name implies, the focus is on cash.

Details about these statements can be found in other articles:
Balance sheet: Measuring Financial Position
Income statement: Measuring Performance
Cash flow statement: Measuring Cash Flow

Accrual vs Cash Accounting

Accounting is generally done on either an accrual basis or on a cash basis. Accounting on an accrual basis means recognizing the impact of transactions on financial statements in the period of time when expenses and revenues occur, not necessarily when cash exchanges hands. Accounting on a cash basis means the impact of transactions on the financial statements are recognized when cash is received or disbursed.

An example should help clarify. Suppose you sell a product to a customer and agree to let the customer pay in 60 days. With accrual accounting, you record the sale as revenue as soon as the customer has bought the product, even though it has not been paid for yet. In cash accounting, your financial statements would not be affected until you received payment.

The same principle applies if you bought office equipment for your business and the vendor offered you 60 day terms. With accrual accounting, the expense would be recorded on your financial statements immediately. With cash accounting, the transaction would only be recorded in your financial statements when you paid for the equipment.

The accrual basis generally the recommended way of accounting but very small businesses often use the cash basis because it can be simpler and easier to manage.

For years accountants have debated the merits of accrual versus cash accounting. There seems to be a general consensus that while cash is important, focusing on it creates a narrow and incomplete picture. Accrual basis accounting is a better measure for relating company efforts to its accomplishments. It produces a more complete picture of the company’s value-producing efforts.

The Accounting Time Period

In order to gauge an organization’s performance, owners and managers want periodic reports that can be used to measure progress. A company’s fiscal year is a year established for accounting purposes. Companies measure and report income for each fiscal year. Many companies choose January 1st as the start, and December 31st as the end of their fiscal year. While any start date can be chosen, January 1st is popular simply because it corresponds to the calendar year.

Interim reports are sometimes provided at various times thought the fiscal year (quarterly, monthly etc.).

Categories
Marketing

SWOT – Marketing Analysis

One of the most popular tools used for business strategic planning is the SWOT analysis.

A SWOT analysis means evaluating your company’s:

  • Strengths
  • Weaknesses
  • Opportunities
  • Threats

Let’s take a closer look:

Opportunities are areas of buyer need where your company can perform profitably. The best opportunities are the ones that are relatively easy for the company to pursue and that have a high probability of success.

Threats are the challenges posed by unfavourable developments or trends that could lead to reduced profits. Examples of threats could include the development of a superior product by a competitor, a high chance of a prolonged economic depression or unfavourable government legislation. Of course, there could be many more.

Strengths and Weaknesses

It’s one thing to be able to sniff out opportunities, having the competencies to take advantage of them is just as important. You don’t have to correct all of your business’s weaknesses (that’s usually impossible). The big question is whether or not you should stick to opportunities where your company has the necessary strengths, or whether your company should acquire or develop new strengths.

It’s a good idea to evaluate your business’s strengths and weaknesses periodically. It will help guide your decisions about which opportunities to pursue, and where you company should improve.

You can use a form like the sample below. To get started, download it as a spreadsheet and tailor it to your needs.

Download SWOT Checklist » (30 KB .zip)

Sample Strengths/Weaknesses Analysis Checklist – HelpSME.com    
    Performance     Importance    
    Major Strength   Minor Strength   Neutral   Minor Weakness   Major Weakness     High   Medium   Low    
Marketing                                      
1. Company reputation                                      
2. Product quality                                      
3. Service Quality                                      
4. Market Share                                      
5. Pricing effectiveness                                      
6. Distribution effectiveness                                      
7. Promotion effectiveness                                      
8. Sales force effectiveness                                      
9. Innovation effectiveness                                      
10. Geographical coverage                                      
                                       
Finance                                      
11. Cost/availability of capital                                      
12. cash flow                                      
13. Financial Stability                                      
                                       
Manufacturing                                      
14. Facilities                                      
15. Economies of scale                                      
16. Capacity                                      
17. Able, dedicated workforce                                      
18. Ability to produce on time                                      
19 Technical skills                                      
                                       
Organization                                      
20. Visionary capable leadership                                      
21. Dedicated employees                                      
22. Entrepreneurial orientation                                      
23. Flexible/responsive                                      
                                       
                                       
Categories
Marketing

Product Life Cycle

Products rarely, if ever, sell well forever. As your product, market, and customers change over time, so should your company’s differentiating and positioning strategy. To better manage a product over it’s lifespan, it’s important for managers and business people to understand the basics of what a product life cycle is.

The Concept of the Product Life Cycle

To say a product has a life cycle is to assert these four things:

  1. Products have a limited life.
  2. Product sales pass through distinct stages. Each stage presents different challenges and opportunities to the seller.
  3. Profits rise and fall at different stages in the product life cycle.
  4. Products need different business strategies in each stage of their life cycle.

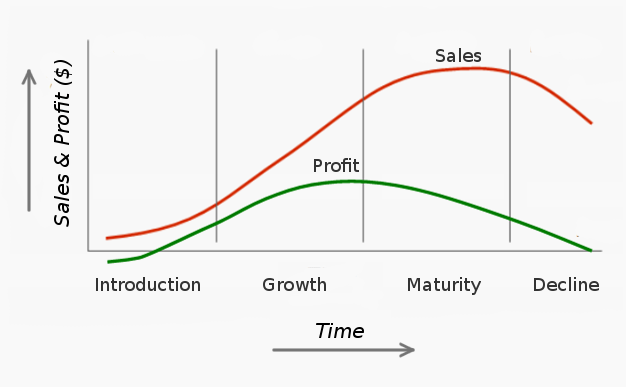
The sales an profitability of most products follow a bell shaped curve over time. Most marketers divide this curve into four stages: introduction, growth, maturity, and decline. You can use the Product Life Cycle concept to analyze product categories (liquor), a product form (white liquor), a product (vodka), as well as a brand (Grey Goose).

Product Life Cycle

Life Cycle Stages

  1. Introduction: A period of slow sales growth as the product is first introduced to the market. During this stage, profits are low or non-existent because of the costs incurred introducing the product.
  2. Growth: A period of rapid market acceptance and significant profit improvement.
  3. Maturity: A period when sales growth slows down because the product has been accepted by most potential buyers. Profits stabilize or decrease because of increased competition.
  4. Decline: The period when sales drift downwards and profits decrease.

The Pattern Is Not Always Bell-Shaped

Keep in mind that not all products follow a bell-shaped life cycle pattern as shown in the diagram above. Researchers have identified over a dozen different Product Life Cycle patterns. For example, a fashion fad becomes popular quickly, peak early, and decline very fast. Fads don’t usually last long because most of them don’t satisfy a strong need.

Product Life Cycle for Tech Products

Technology products are another interesting and important case. The life cycle curve for technology products tends to be compressed, as described in this BBC video:

Conclusion

The product life cycle stages explain the changes in sales and profitability of products over their lifespan. To improve profitability and market positions, product managers need to use appropriate strategies for each life cycle stage.

Categories
Marketing

How to Write a Marketing Survey

How to Write a SurveyMarketing surveys are useful tools because they can help you gather information to make more informed business decisions. How big is your target market? Will the product you’re considering launching appeal to your current customers? What are the attitudes of your customers about your company or product(s)? Surveys can help you answer these and other questions.

Steps:

  1. Determine the purpose of your survey. What information are you trying to find? Maybe you’d like to determine if your product offering should be changed or tweaked. Or are you trying to find out how satisfied (or unsatisfied) your customers are. Perhaps you’re trying to determine the behaviour and habits of your target customers.
  2. Decide who should fill out your survey. Who is your target audience? Decide if your respondents should be your website visitors, previous customers, coffee shop customers, university students etc. It’s important to get relevant respondents to have meaningful data.
  3. Develop a set of questions that all respondents will fill out. There are a wide variety of question types you can use. Examples include yes/no, multiple choice, ratings, and open ended questions. Choose the question type(s) most appropriate for your circumstances.
  4. Distribute the survey. Using your email opt-in list is the most cost effective. If you don’t have a customer list, you can subscribe to a marketing service that will give you addresses of potential respondents who have shown interested in your field. Surveys can also be sent by mail or given out by hand.
  5. Collect, view and interpret the data. If you you’ve handed out and collected old school paper surveys, somebody will need to input the data into some kind of survey software for easier analysis. Online surveys are easier to manage and most survey software you find today can generate useful charts and summaries to help you draw conclusions.

Tips:

  • People are more likely to do something if there is something in it for them. Use incentives to increase response rates. Offer things like discounts or coupons, especially if your survey is long and boring. At the very least, explain the purpose of your survey and how the respondent’s answers will benefit them, society, polar bears or whatever.
  • Ask personal questions such as age and gender at the end of the survey. Respondents will more likely answer them if they are positioned near the end.
  • Keep the survey as short as possible. The more questions you ask, the more information you can obtain but the less likely the survey will be completed by the respondent. It’s a balancing act. Make sure each question has a purpose.
  • Be sure to keep the questions in the same order for each respondent.
  • Make the questions clear and pay attention to phrasing – avoid “leading” and “loaded” questions. These types of questions tend to bias results.

    • Leading questions use language which suggests a particular answer and can serve as a form of persuasion. For example, this is a leading question: “Don’t you prefer buying from shops that offer discounts regularly?”. Better phrasing would be “Do you prefer buying from shops that offer discounts regularly?”
    • Loaded questions should be avoided because they contain assumptions that may not be true. An commonly used example of a loaded question is: “Have you stopped beating your wife?” This question assumes that you have beaten your wife and that you are, in fact, married. If you are not married, or have never beaten your wife, then the question is loaded.